Which cars hold their value best in the UAE?
We measured how fast asking prices fall with each year of age for the brands and models most listed on Dubizzle in the UAE, from Toyota and Kia to Land Rover and Jaguar.
Resale value is easy to leave out of a car budget. Insurance and fuel arrive as regular bills, while depreciation is paid once, on the day you sell, long after the decision was made.
We cannot see what cars sell for, only what sellers ask. But with every active Dubizzle listing in our index we can line up asking prices by model year and see how quickly each brand and model falls as it ages. Everything below uses listings as of 7 October 2026.
How to read “value lost per year of age”
For each model we take the GCC-spec listings, find the median asking price of each model year, and fit the rate at which that median drops for each extra year of age. A brand’s figure is the median of its models’ figures. So when we say Toyota loses 9.9% a year6, we mean that on today’s listings a Toyota one model year older typically asks about 9.9% less6, model for model.
This compares different cars of different ages on the same day. It does not follow one car through its life. We only publish a brand figure for brands with 100 or more listings, and only from models with at least three model years that have enough GCC listings57. Below that the figure is n/a.
Brands that lose the least
| Brand | Value lost per year of age | Median age of listed cars | Active listings |
|---|---|---|---|
| Suzuki | 1.7%75 | 2 years74 | 36173 |
| Kia | 8.5%42 | 5 years41 | 88040 |
| Toyota | 9.9%6 | 4 years5 | 3,6154 |
| Geely | 10.4%102 | 1 year101 | 229100 |
| RAM | 11.1%132 | 2 years131 | 144130 |
| MG | 11.2%48 | 2 years47 | 57546 |
| Mitsubishi | 11.7%24 | 6 years23 | 1,09122 |
| Jetour | 11.8%81 | 1 year80 | 33379 |
Read the age column before the first one. Suzuki’s 1.7%75 is the lowest figure in the data, but half the Suzukis for sale are two years old or younger74, so the figure mostly describes young cars. We would not read it as proof that a Suzuki barely depreciates. Geely and Jetour are in the same position, with a median listed age of one year10180. Their used market is not old enough yet to say much past the first couple of model years.
Toyota and Kia are a different case. Toyota’s figure rests on 3,615 listings4 with a median age of four years5, Kia’s on 880 listings40 at five years41. Those cars are older than the young brands above, so their figures have been tested over more model years.
Brands that lose the most
| Brand | Value lost per year of age | Median age of listed cars | Active listings |
|---|---|---|---|
| BMW | 18.1%12 | 5 years11 | 2,24010 |
| Audi | 18.2%27 | 5 years26 | 1,06925 |
| Infiniti | 18.7%60 | 7 years59 | 51658 |
| Cadillac | 19.0%87 | 4 years86 | 29885 |
| Land Rover | 19.2%15 | 6 years14 | 1,87013 |
| Bentley | 20.4%78 | 7 years77 | 33376 |
| Jaguar | 23.1%111 | 8 years110 | 183109 |
German and British premium badges fill most of this table. Mercedes-Benz, the most listed brand in the index with 4,160 cars1, sits in the middle at 15.6%3, next to Ford at 15.4%18 and Volkswagen at 15.7%45. Nissan loses 13.0%9, Porsche 13.8%21, Lexus 14.0%30 and Jeep 14.7%39.
Model by model
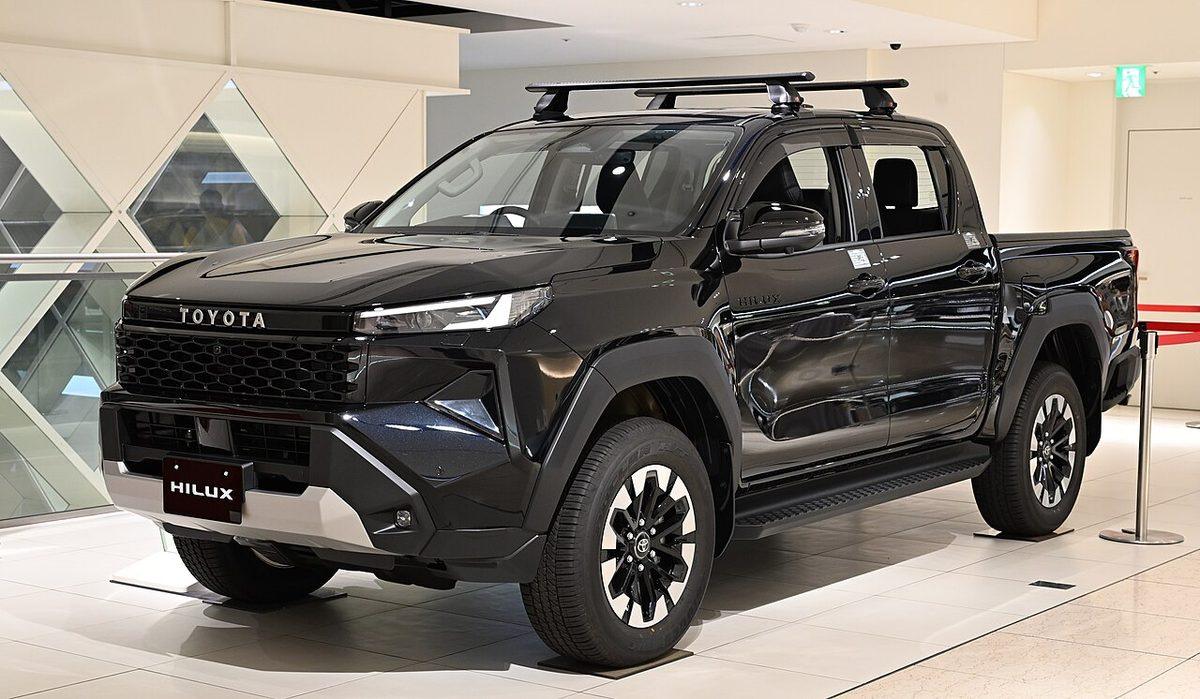
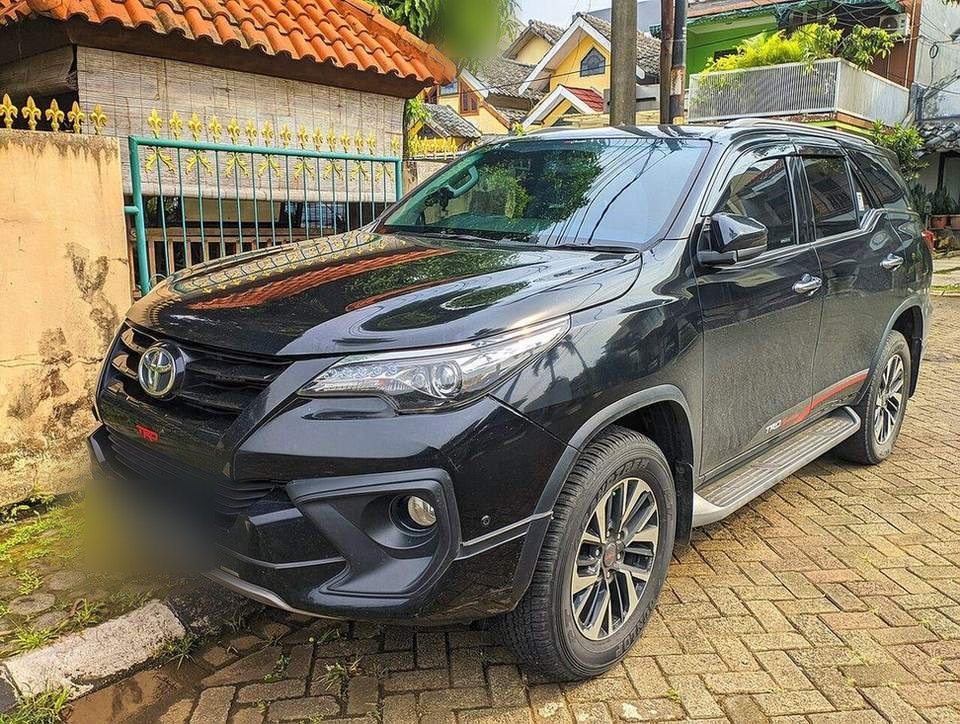
Brand figures hide a wide spread. Inside Porsche, the 911 loses 9.4% a year470 and the Cayenne 20.2%476. Inside Toyota, the Fortuner loses 7.3%485 and the Camry 14.3%491. The table shows the slowest and the fastest losers among the most listed models in the index, not every model we measured.
| Model | Value lost per year of age | Active listings |
|---|---|---|
| Toyota Fortuner | 7.3%485 | 234485 |
| Toyota Yaris | 8.9%490 | 218490 |
| Toyota Prado | 9.3%474 | 388474 |
| Toyota Corolla | 9.3%486 | 229486 |
| Porsche 911 | 9.4%470 | 464470 |
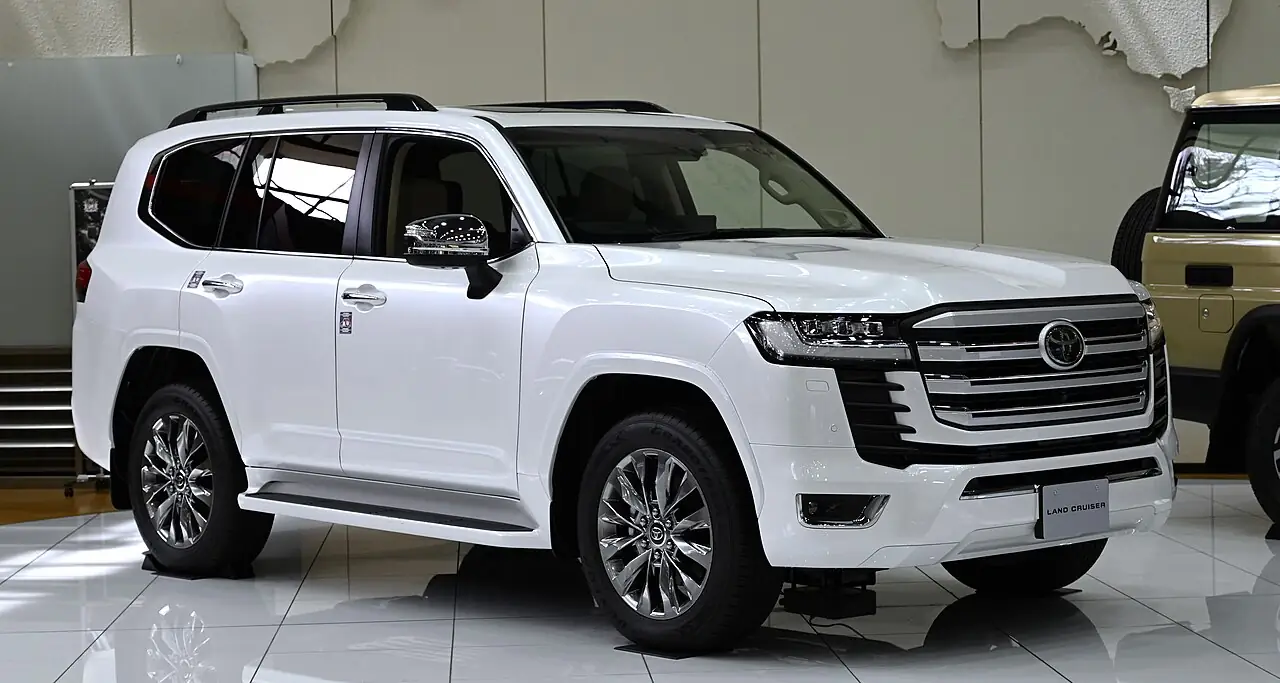
| Toyota Land Cruiser | 9.9%464 | 734464 |
| Toyota Rav 4 | 10.8%482 | 255482 |
| Mitsubishi Pajero | 11.1%475 | 385475 |
| Mercedes-Benz S-Class | 17.2%472 | 438472 |
| BMW 5-Series | 17.5%487 | 229487 |
| Ford Explorer | 18.3%488 | 229488 |
| BMW X5 | 18.3%477 | 303477 |
| Porsche Cayenne | 20.2%476 | 376476 |
| Land Rover Range Rover | 21.6%465 | 625465 |
| Land Rover Range Rover Sport | 22.7%471 | 452471 |
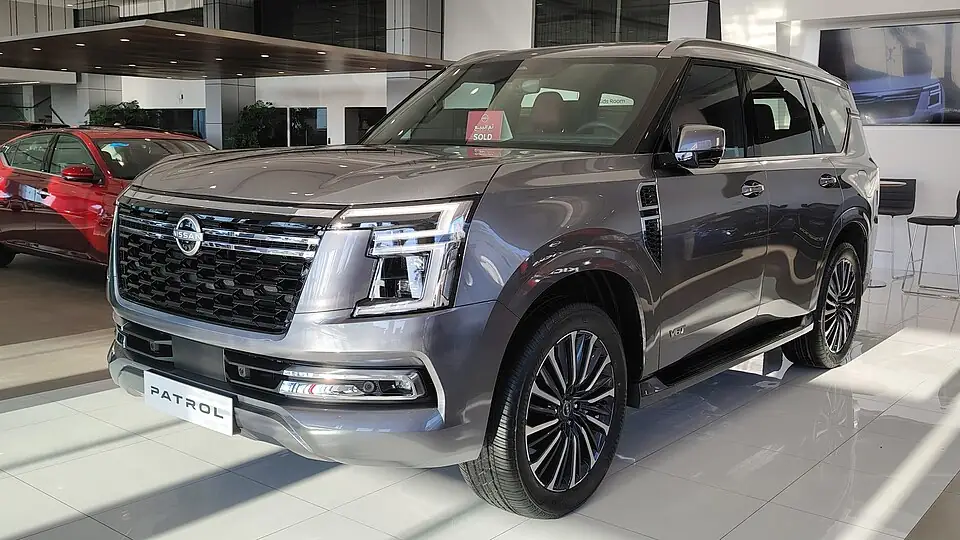
The two most listed models in the index are a good example. The Nissan Patrol, with 985 listings463, loses 15.1% a year463. The Toyota Land Cruiser, with 734464, loses 9.9%464. They compete for the same buyers, and the gap between them adds up over a few years of ownership. We set them side by side in Land Cruiser vs Patrol, and you can run your own pair in compare.
Further down the list, the Lexus LX loses 14.0% a year479, the Nissan Altima 15.8%480, the Jeep Grand Cherokee 16.2%481 and the Mercedes-Benz G-Class 16.6%466.
Chinese brands and Ferrari: where there is no figure
BYD has 311 listings in the index82, but its median age is one year83 and its yearly loss comes out n/a84. Changan is n/a114, with a median listed age of 0 years113, which means at least half the Changans on sale are this year’s models. GAC is n/a120. MG, Geely and Jetour do have figures, listed in the first table, but on cars that are still young. Our Chinese cars page tracks these brands as their used markets fill in.
Ferrari is n/a too57, despite 521 listings55. The brand clears the listing threshold, so the gap is at model level: no Ferrari model has enough GCC listings across enough model years to fit a rate.
What this means if you are buying
The decision rule: between two cars at a similar price that you plan to keep for a few years, take the one with the lower yearly loss, provided the brand’s figure was measured on cars as old as yours will be when you sell. If the brand’s listed cars have a median age of one or two years, as with Jetour80 or MG47, the figure has not been tested at the age you will sell at, so give more weight to the warranty and to any buy-back terms the dealer offers.
Bear in mind that a low yearly loss says nothing about the price you pay on day one. Compare the asking price of the specific car with other cars of the same model year before you decide.
- Open the model page, for example the Toyota Fortuner or the Range Rover Sport, to see asking prices by model year.
- Open the running-costs page to see depreciation next to running costs such as insurance and fuel.
- Check a specific listing against the market on the Check a seller’s price page.
- If your budget is fixed, start from the budget tool, then check each shortlisted model against the tables above.
- Watch the deals page for slow-losing models listed under their model median.
How we measured
We used every active listing in our Dubizzle index on 7 October 2026, priced within our standard price range. For each model, we took the median asking price of GCC-spec cars in each model year, leaving out years with too few listings, and fitted the yearly rate of decline. A brand’s figure is the median of its models’ rates, and we only publish one for brands with 100 or more listings and where at least one model has three model years with enough GCC listings57. The brand figures above rest on between 144 listings (RAM130) and 4,160 listings (Mercedes-Benz1). The model figures rest on between 211 listings (Toyota Camry491 and Nissan Pathfinder492) and 985 listings (Nissan Patrol463). Listing counts include all specs, while the price trends use GCC-spec cars only.
These are asking prices, not sale prices, and a listing that disappears is not necessarily sold. The full method, including how we filter specs and prices, is on the methodology page.
Figures used
Every small number in the text points to one line here: the figure, what it measures, how many listings it stands on and the day it was read.
Show the 83 figures
- 1 4,160 listings Mercedes-Benz active listings read 7 October 2026
- 3 15.6% per year Mercedes-Benz typical value lost per year of age 4,160 listings, read 7 October 2026
- 4 3,615 listings Toyota active listings read 7 October 2026
- 5 4 years Toyota median age of listed cars 3,615 listings, read 7 October 2026
- 6 9.9% per year Toyota typical value lost per year of age 3,615 listings, read 7 October 2026
- 9 13% per year Nissan typical value lost per year of age 3,094 listings, read 7 October 2026
- 10 2,240 listings BMW active listings read 7 October 2026
- 11 5 years BMW median age of listed cars 2,240 listings, read 7 October 2026
- 12 18.1% per year BMW typical value lost per year of age 2,240 listings, read 7 October 2026
- 13 1,870 listings Land Rover active listings read 7 October 2026
- 14 6 years Land Rover median age of listed cars 1,870 listings, read 7 October 2026
- 15 19.2% per year Land Rover typical value lost per year of age 1,870 listings, read 7 October 2026
- 18 15.4% per year Ford typical value lost per year of age 1,504 listings, read 7 October 2026
- 21 13.8% per year Porsche typical value lost per year of age 1,177 listings, read 7 October 2026
- 22 1,091 listings Mitsubishi active listings read 7 October 2026
- 23 6 years Mitsubishi median age of listed cars 1,091 listings, read 7 October 2026
- 24 11.7% per year Mitsubishi typical value lost per year of age 1,091 listings, read 7 October 2026
- 25 1,069 listings Audi active listings read 7 October 2026
- 26 5 years Audi median age of listed cars 1,069 listings, read 7 October 2026
- 27 18.2% per year Audi typical value lost per year of age 1,069 listings, read 7 October 2026
- 30 14% per year Lexus typical value lost per year of age 1,027 listings, read 7 October 2026
- 39 14.7% per year Jeep typical value lost per year of age 937 listings, read 7 October 2026
- 40 880 listings Kia active listings read 7 October 2026
- 41 5 years Kia median age of listed cars 880 listings, read 7 October 2026
- 42 8.5% per year Kia typical value lost per year of age 880 listings, read 7 October 2026
- 45 15.7% per year Volkswagen typical value lost per year of age 870 listings, read 7 October 2026
- 46 575 listings MG active listings read 7 October 2026
- 47 2 years MG median age of listed cars 575 listings, read 7 October 2026
- 48 11.2% per year MG typical value lost per year of age 575 listings, read 7 October 2026
- 55 521 listings Ferrari active listings read 7 October 2026
- 57 n/a Ferrari typical value lost per year of age 521 listings, read 7 October 2026
- 58 516 listings Infiniti active listings read 7 October 2026
- 59 7 years Infiniti median age of listed cars 516 listings, read 7 October 2026
- 60 18.7% per year Infiniti typical value lost per year of age 516 listings, read 7 October 2026
- 73 361 listings Suzuki active listings read 7 October 2026
- 74 2 years Suzuki median age of listed cars 361 listings, read 7 October 2026
- 75 1.7% per year Suzuki typical value lost per year of age 361 listings, read 7 October 2026
- 76 333 listings Bentley active listings read 7 October 2026
- 77 7 years Bentley median age of listed cars 333 listings, read 7 October 2026
- 78 20.4% per year Bentley typical value lost per year of age 333 listings, read 7 October 2026
- 79 333 listings Jetour active listings read 7 October 2026
- 80 1 years Jetour median age of listed cars 333 listings, read 7 October 2026
- 81 11.8% per year Jetour typical value lost per year of age 333 listings, read 7 October 2026
- 82 311 listings BYD active listings read 7 October 2026
- 83 1 years BYD median age of listed cars 311 listings, read 7 October 2026
- 84 n/a BYD typical value lost per year of age 311 listings, read 7 October 2026
- 85 298 listings Cadillac active listings read 7 October 2026
- 86 4 years Cadillac median age of listed cars 298 listings, read 7 October 2026
- 87 19% per year Cadillac typical value lost per year of age 298 listings, read 7 October 2026
- 100 229 listings Geely active listings read 7 October 2026
- 101 1 years Geely median age of listed cars 229 listings, read 7 October 2026
- 102 10.4% per year Geely typical value lost per year of age 229 listings, read 7 October 2026
- 109 183 listings Jaguar active listings read 7 October 2026
- 110 8 years Jaguar median age of listed cars 183 listings, read 7 October 2026
- 111 23.1% per year Jaguar typical value lost per year of age 183 listings, read 7 October 2026
- 113 0 years Changan median age of listed cars 182 listings, read 7 October 2026
- 114 n/a Changan typical value lost per year of age 182 listings, read 7 October 2026
- 120 n/a GAC typical value lost per year of age 171 listings, read 7 October 2026
- 130 144 listings RAM active listings read 7 October 2026
- 131 2 years RAM median age of listed cars 144 listings, read 7 October 2026
- 132 11.1% per year RAM typical value lost per year of age 144 listings, read 7 October 2026
- 463 15.1% per year Nissan Patrol typical value lost per year of age 985 listings, read 7 October 2026
- 464 9.9% per year Toyota Land Cruiser typical value lost per year of age 734 listings, read 7 October 2026
- 465 21.6% per year Land Rover Range Rover typical value lost per year of age 625 listings, read 7 October 2026
- 466 16.6% per year Mercedes-Benz G-Class typical value lost per year of age 569 listings, read 7 October 2026
- 470 9.4% per year Porsche 911 typical value lost per year of age 464 listings, read 7 October 2026
- 471 22.7% per year Land Rover Range Rover Sport typical value lost per year of age 452 listings, read 7 October 2026
- 472 17.2% per year Mercedes-Benz S-Class typical value lost per year of age 438 listings, read 7 October 2026
- 474 9.3% per year Toyota Prado typical value lost per year of age 388 listings, read 7 October 2026
- 475 11.1% per year Mitsubishi Pajero typical value lost per year of age 385 listings, read 7 October 2026
- 476 20.2% per year Porsche Cayenne typical value lost per year of age 376 listings, read 7 October 2026
- 477 18.3% per year BMW X5 typical value lost per year of age 303 listings, read 7 October 2026
- 479 14% per year Lexus LX-Series typical value lost per year of age 269 listings, read 7 October 2026
- 480 15.8% per year Nissan Altima typical value lost per year of age 263 listings, read 7 October 2026
- 481 16.2% per year Jeep Grand Cherokee typical value lost per year of age 262 listings, read 7 October 2026
- 482 10.8% per year Toyota Rav 4 typical value lost per year of age 255 listings, read 7 October 2026
- 485 7.3% per year Toyota Fortuner typical value lost per year of age 234 listings, read 7 October 2026
- 486 9.3% per year Toyota Corolla typical value lost per year of age 229 listings, read 7 October 2026
- 487 17.5% per year BMW 5-Series typical value lost per year of age 229 listings, read 7 October 2026
- 488 18.3% per year Ford Explorer typical value lost per year of age 229 listings, read 7 October 2026
- 490 8.9% per year Toyota Yaris typical value lost per year of age 218 listings, read 7 October 2026
- 491 14.3% per year Toyota Camry typical value lost per year of age 211 listings, read 7 October 2026
- 492 16% per year Nissan Pathfinder typical value lost per year of age 211 listings, read 7 October 2026
Drafted with AI from our own data, every figure checked against its source, approved by the editor.
The cars in this guide
-
-
-
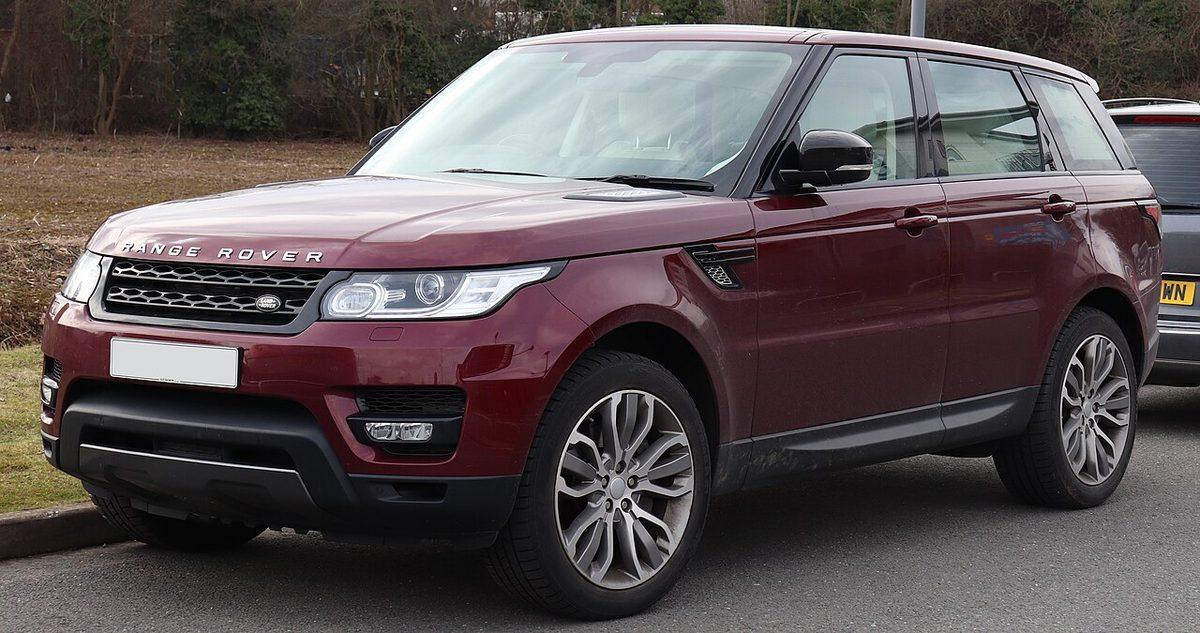
Land Rover Range Rover Sport
A 2024 asks about AED469,000
Middle price of 27 listings, 2 November 2026
Related guides
UAE used car market, October 2026
What is for sale on the UAE used car market this October: how many cars are listed, the median GCC-spec asking price, which brands and models fill the market, and how to use that when you buy.
Land Cruiser vs Patrol: which holds its value better in the UAE?
We lined up the median asking price of GCC-spec Toyota Land Cruisers and Nissan Patrols on Dubizzle, model year by model year, to see which one keeps more of its price as it gets older.